Mapping can transform your energy ideas
With 30 years of experience visualising the energy industry and the knowledge to transform ideas. Visit our store for a wide range of energy related reports, books and maps available in digital PDF.
Our Story
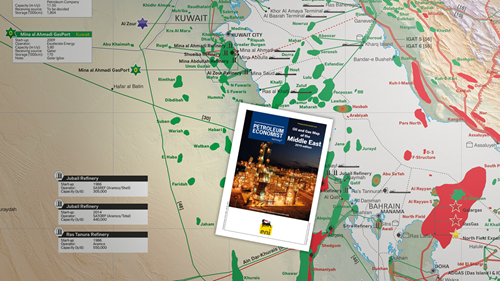
Petroleum Economist Cartographic published its first map outside of the magazine in 1990. The Middle East Oil & Gas Export Routes map was created to give PE subscribers a better picture of the energy scene prior to the outbreak of the first Gulf War. Shortly after came the first sponsored, large-format sheet maps in 1991, looking at the wider energy market, including the first edition of the very popular Energy Map of the World.
- In 1999, we published our first global compilation of maps: the Millennium Energy Atlas and over the next 14 years, we produced six further editions
- In 2002, we introduced five of our new maps to the delegates of WPC in Rio de Janeiro, including the World Oil Map, and have subsequently distributed a range of map titles at Adipec, Gastech, LNG and WGC, at venues across the world
- In 2019, we launched the digital version of the World LNG Map on the ExxonMobil stand at Gastech in Houston
Since our launch in 1990 these maps have increased in detail, increased in quality and style, incorporating satellite imagery in 2005 and live data in 2019. We currently have a portfolio of approximately 50 energy map titles, covering all continents of the world, at country, regional and global scales, each of which took on average three months to create, design and produce. These maps are adorned with the brands and logos of many of the industry's leading stakeholders.
 |
 |
Case Studies
- Interactive Hydrogen Dashboard
- Interactive LNG Dashboard: Sponsored by ExxonMobil
- The Interactive World LNG Map Version 4.0 is a comprehensive source of LNG related facilities and project data. The web-based platform allows individuals to access the latest project data (including facility status and ownership details), detailed pipeline information, vessel/shipping information, and more
- The dashboard serves as a single reference source for all LNG projects across the globe
- The platform allows users to interrogate project information, view gasfields and pipelines in our global interactive map, and analyse a wide range of data on the LNG industry in a series of interactive graphics
- The ESRI-based (Environmental Systems Research Institute) platform is updated in real-time by a dedicated support team, thereby ensuring that the latest LNG data—regardless of project location or status - is readily available
- Access to the Interactive World LNG Map is FREE with a subscription to the ExxonMobil LNG newsletter. Click on the ‘Sign Up’ button on the right to subscribe to the newsletter. Once you have submitted your subscription, you will receive an email containing a link to access the platform
Map Partnership
Petroleum Economist is the world’s leading provider of energy maps.
The maps and factbooks are of high value to oil and gas industry executives around the world. Exclusive sponsorship of a PE map generates an association between the sponsor and the map, and guarantees repeat brand exposure for a minimum of 12 months.
For three decades we have partnered with the leading energy companies to deliver our print and digital products. Over one million maps have been distributed to all the Petroleum Economist subscribers and at major industry events.
If you want to become one of our map partners and see the benefits, contact our commercial team.