

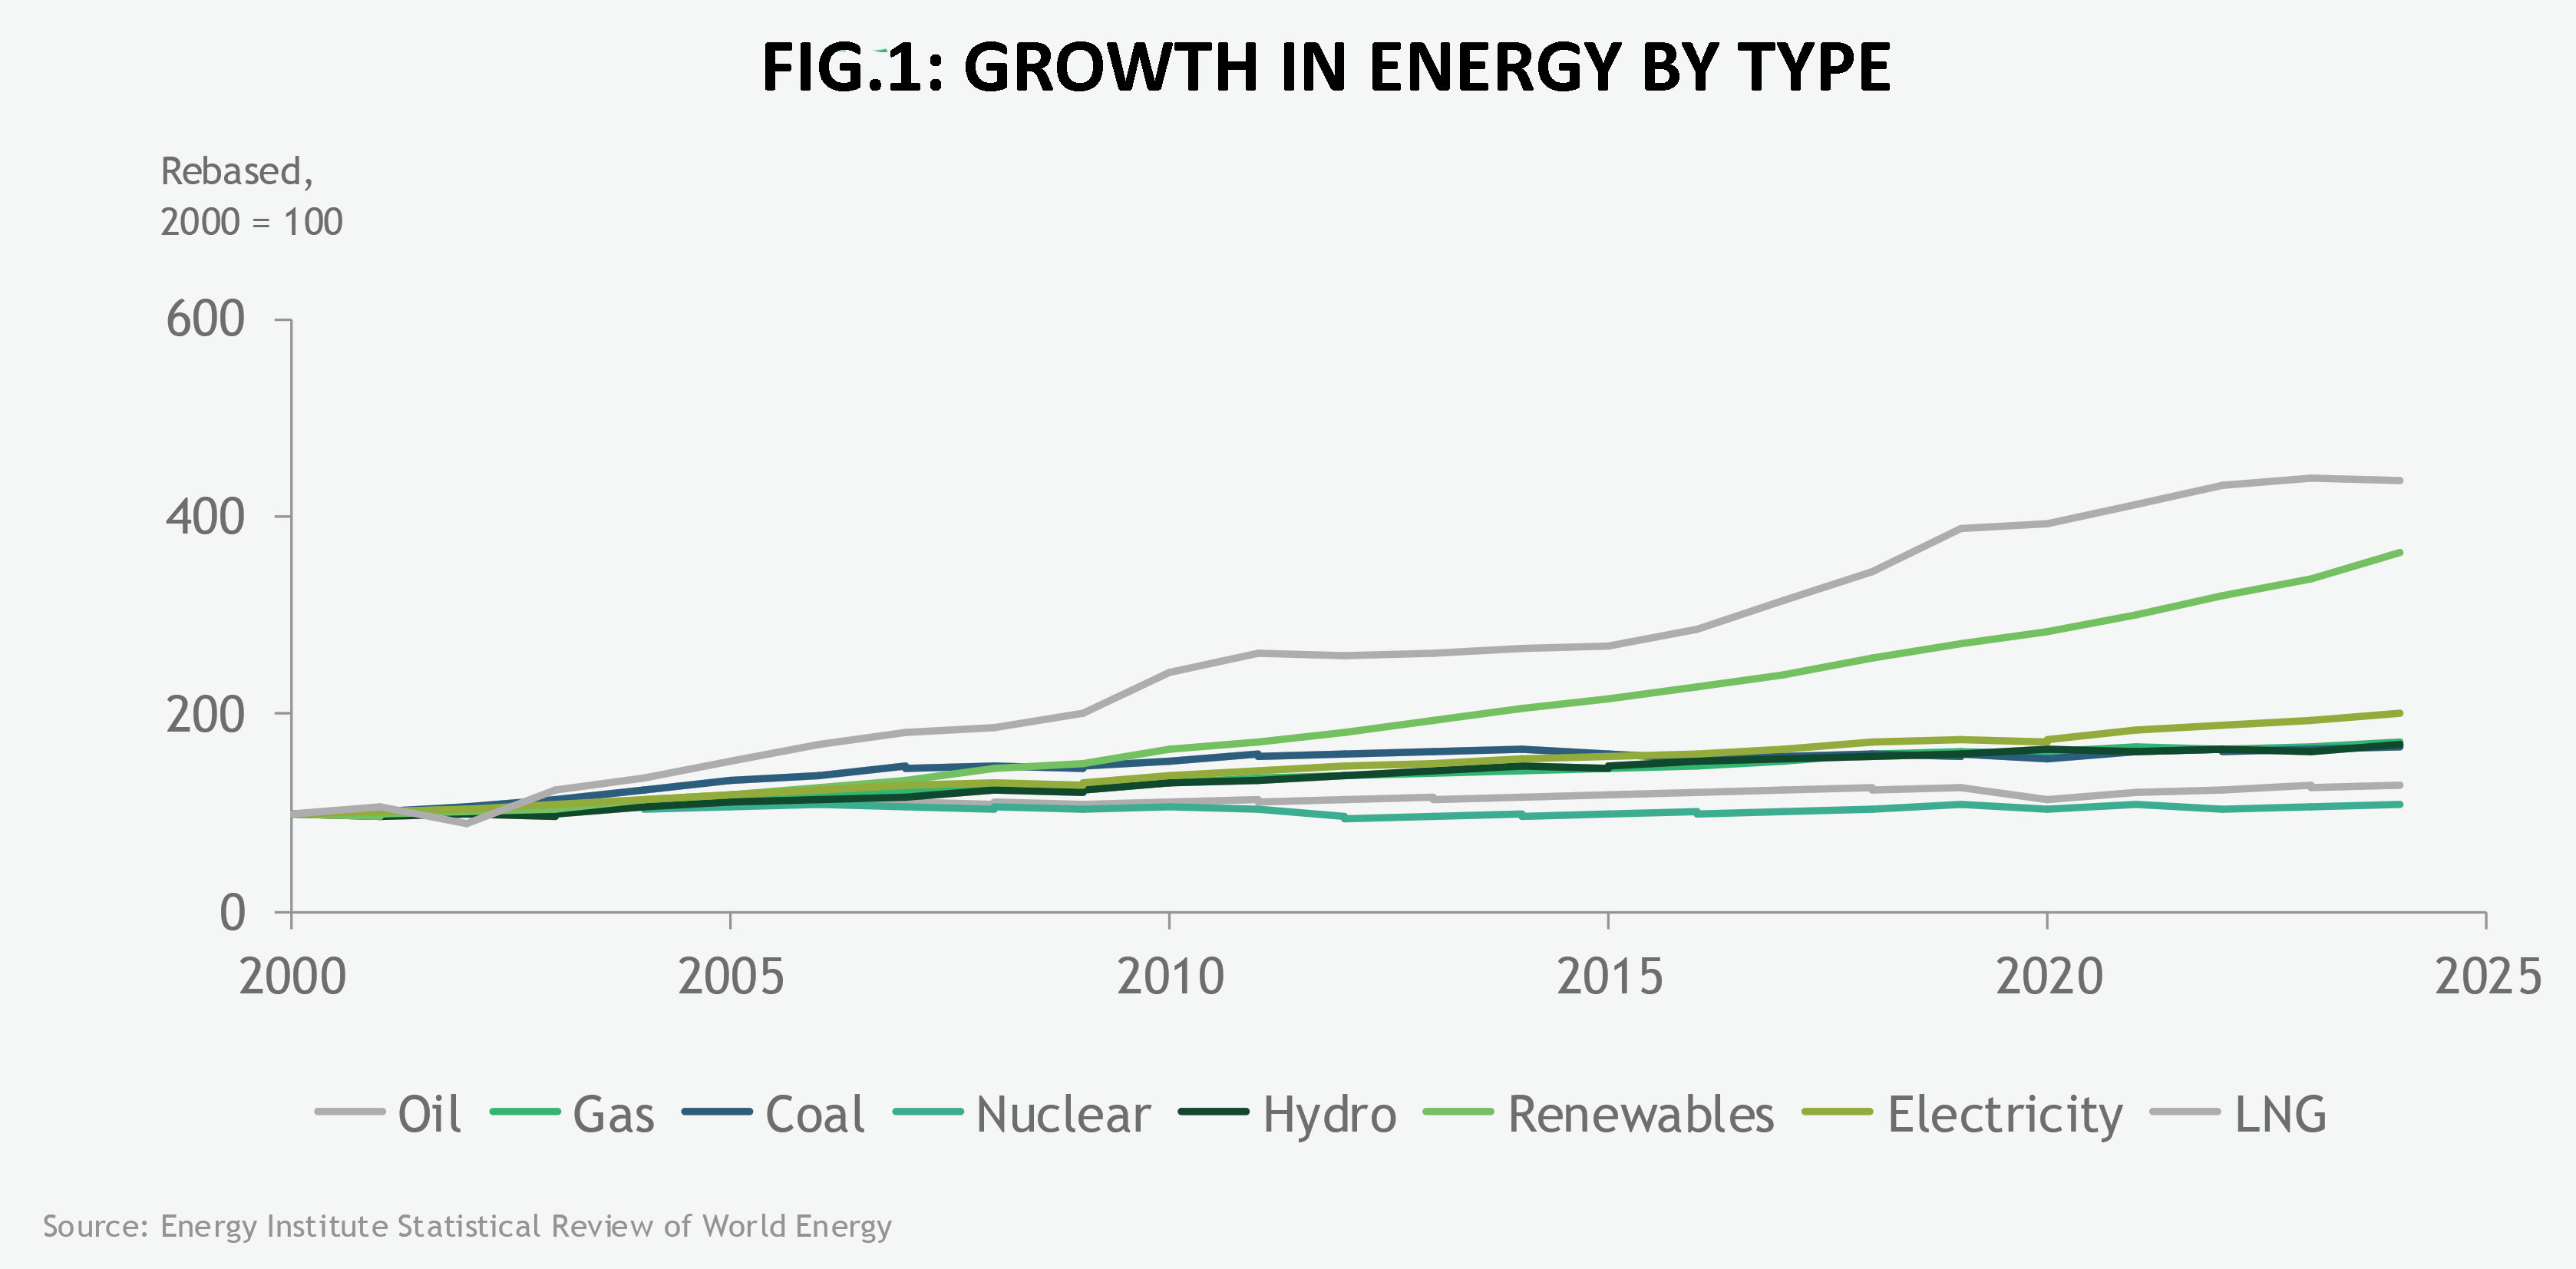
LNG is among the fastest-growing energy types of the past 25 years. It now reaches more than 50 countries—increasing energy security, backing out coal in many places and providing valuable feedstock for industrial demand.
The market is now facing down a third wave of substantial LNG supply. The first was Qatar’s growth in the late 2000s, and the second kicked off by US shale and then the loosening of LNG export rules. This prompted US LNG production to surge from about 5bcm in 2016 to more than 123bcm in 2024. Other regions also saw growth, with Russia nearly trebling over the same period and Australia also growing substantially. Each of these waves took time for demand to catch up, but long-term contracts and the still relatively nascent development of the LNG market limited its broader effects.
This third wave of production growth is larger than any period before—as much as 350bcm of new capacity, much of it from the US Gulf Coast and Qatar. The pace in 2025 is record-breaking, with 75mt/yr sanctioned since the start of the year—nearly 90% of which in the US.
But this wave is also accompanied by significant uncertainty in the LNG market: will this cause an oversupply, and when and how long would it last? Previously, project delays could be counted on to slow the pace of supply, reducing the potential for an oversupplied market as well as shortening its duration, but the speedy pace of project sanctions, if kept up through commercial operation date, augurs for a coming oversupply by 2028 to as late as 2030.
Regardless of the uncertainty, it is still worth thinking through the second-order effects of such an over-supply situation. The first order effect is of course on market pricing, which falls to short-run marginal costs as the utilisation of marginal LNG liquefaction plants falls. This brings European and Asian prices to $6–8/m Btu, well below current prices. Potential second-order effects include the following:
Substantial increase in LNG demand: BCG research suggests a low-price environment could spur demand to expand from the current 50 import-capable countries to as many as 80. The fact that most current importers also have high shares of their contracts set as gas-on-gas also means that low natural gas prices would be felt by many traditional LNG buyers. This will increase elasticity, resulting in a more rapid uptake of price-induced demand response relative to what was present in prior waves. This in turn may help to reduce the overall duration of the oversupply.
Stress on marginal LNG facilities: The US Gulf Coast is home to marginal LNG facilities. Projects that will feel the market stress first include those with high tolling fees that are delivered ex-ship. This exposes the project owner to the potential of cancelled cargoes—leaving them with just the tolling fee and potentially underutilised pipeline capacity and excess natural gas. This project marginality is potentially exacerbated by the upward price pressure that the Henry Hub may experience in the coming years, caused by a combination of rapidly increasing power demand amid insufficient pipeline capacity expansions. During this period there is an increased potential for some end-users to force the renegotiation of contracts—something that has been done to other projects in the past during times of stress. US producers are also facing a growing concentration risk as the contracted quantity of LNG set for Chinese buyers increases from the current 5% to almost 30% over the next ten years.
Cost: Pockets of cost savings will be available, but broad cost savings will be more difficult to execute. While the low-price environment will create substantial pressure to reduce costs at LNG facilities—similar to what was done in the shale patch after the price declines of 2008 and 2014—it will be more difficult as a result of the current EPC, labour and financing market, as well as the different dynamics of the frequently repeated shale drilling model versus just a few liquefaction facilities. More ready cost-savings opportunities will exist in the optimisation of processes and workflows. Cost reduction opportunities will also be likely in shipping, via time-charter and spot rates, as traders also arbitrage more routes given greater vessel availability.
Differentiated gas: This could be an additional pressure point that allows the EU methane regulations, which culminate in intensity limits in 2030, to proceed without interruption, and potentially even see the demand and policy expand into other regions.
Impacts on trading: Unlike prior waves, traders hold a larger portion of capacity than in the past. This also includes more regas capacity, giving them greater flexibility in turbulent markets. In addition to the effects above, traders will use this stress period to speed up an expected move towards optimisation and evolution of the LNG trading market, which is still nascent, growing from just 5% of all gas in 2000 to 13% today and on its way to more than 20% in the future. This volume expansion will mean more increased liquidity of spot volumes, allowing an evolution in LNG trading as it matures. This optimisation will include trading around the indexation wanted, expanding collaboration between market players and likely seeing greater use of, and demand for, freedom from destination clauses.
A period of oversupply will significantly stress the LNG market, but the pressure it exerts will also open new sources of demand, inject more capital discipline into operations and accelerate the evolution of LNG trading. What will emerge on the other side of the oversupply period will be a healthier market that will be in need of new supply—in which case the rapid deployment of FSRUs may rotate into a rapid deployment of new FLNG projects.
Jamie Webster is partner and association director at the BCG Center for Energy Impact and fellow, Global Center for Energy Analysis. This article is taken from our Outlook 2026 report. To read Outlook in full, click here.


Comments